ILLUSTRATIONS
How to visualize cause and effect

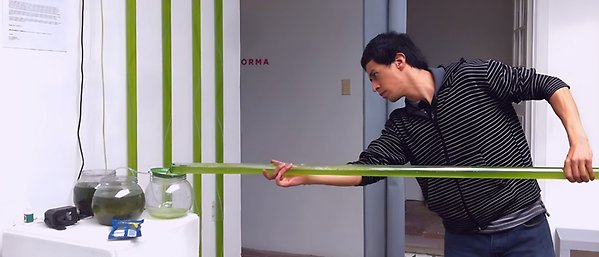
In a paper published in Ecology & Society, researchers examine the strengths and weaknesses of different visualizations that can be used to illustrate causality. Most visualizations aim for simplicity, in the case of complex systems however this simplicity can be a misrepresentation. Photo:N. Ryrholm/Azote
Study examines the strengths and weaknesses of different visualizations that can be used to illustrate causality in social-ecological systems
- Visualizing cause and effect is important but it is tricky to do
- Visualization types differ in their suitability to meet challenges in visualizing complex systems causality
- Combining visualizations can be a solution to deal with complexity – but especially needs careful design and explanation
WHAT DO YOU SEE? Visualizations are often used to identify and communicate causal relationships in human-nature interactions, but do they do the trick?
Not always. That is why it’s important to be clear on what specific cause and effect that is illustrated in a figure.
This is the conclusion from a study recently published in Ecology and Society.
The publication is part of CauSES, an research project hosted at SRC exploring knowledge, theories and methods on causation.
The authors, which include centre researchers Tilman Hertz, Lars-Göran Johansson, Emilie Lindkvist, Rodrigo Martinez-Peña, Sonja Radosavljevic and Maja Schlüter, examine the strengths and weaknesses of different visualizations that can be used to illustrate causality.
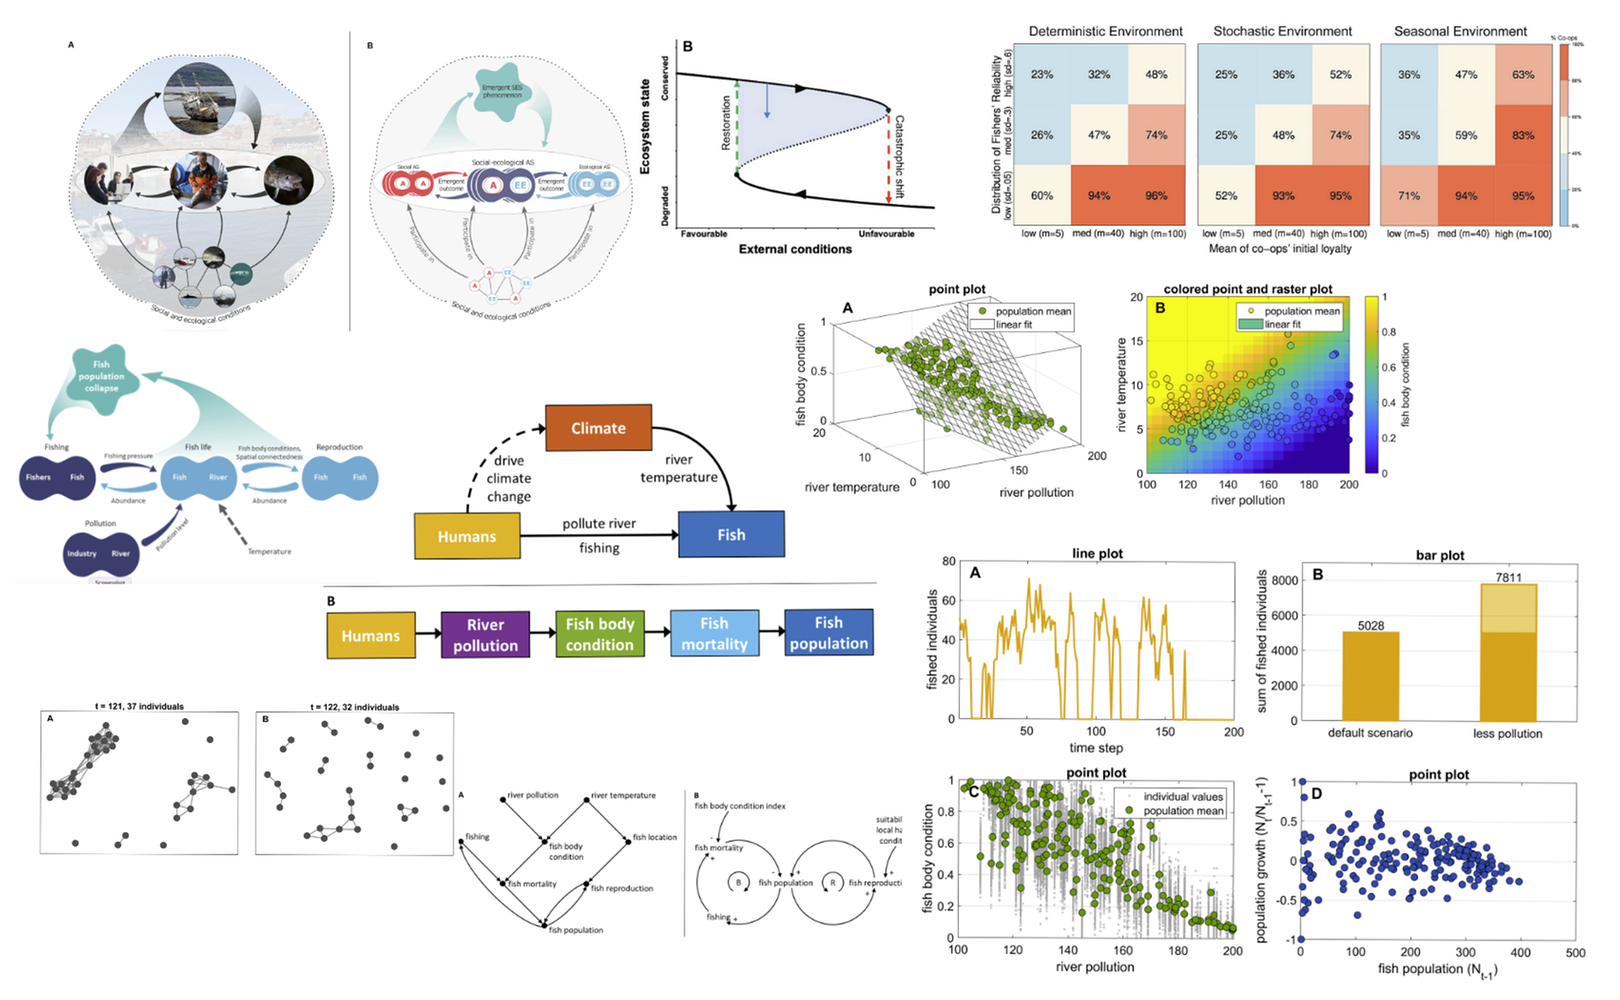
Multiple types of visualizations of causal relationships were assessed in the study. Examples include various versions of diagrams of objects and arrows, such as conceptual diagrams, formal causal diagrams and network diagrams, and of X-Y plots and X-Y-Z plots.
What is suitable
In everyday life we make many assumptions about causality without thinking too much, often concerning straightforward things – a plant will not grow without water for example.
But for social-ecological systems, composed in part of people who interact and make decisions, teasing out what causes what in such a complex system is easier said than done.
The way we visualize a complex system affects our understanding of it and what kind of conclusions we come to. We want to bring awareness to this and offer some guidance in choosing suitable visualizations in social-ecological systems research.
Thomas Banitz, lead author
What is represented and how
While an image may say more than a thousand words, thoughtful choice and design, along with additional guidance, such as a clearly formulated caption, are often key to ensuring the reader takes away the intended meaning from a figure.
Most visualizations aim for simplicity to offer a clear explanation that sticks in the memory of the reader. In the case of complex systems however this simplicity can be a misrepresentation. To avoid this, one solution the authors suggest is combining multiple visualizations in the same figure.
“Our assessment enables the informed selection and combination of the appropriate visualization type(s) depending on the research question, the purpose, the knowledge about causal relationships in the SES, and the properties and part(s) of the system that shall be the focus of a figure”, the authors conclude.
Read Visualization of causation in social-ecological systems
Methodology
The authors assessed how well the different visualization types meet six key challenges in visualizing cause and effect in complex social-ecological systems:
1. Visualizing whether a relationship is causal.
2. Visualizing the characteristics of causal relationships.
3. Visualizing reciprocal causal relationships.
4. Visualizing multiple causes.
5. Visualizing temporal dynamics of causal relationships.
6. Visualizing uncertainty about causal relationships.
Potential and limitations with regard to these challenges were discussed for each visualization type. Example figures were created based on hypothetical SES data, generated with an individual-based simulation model developed for this demonstration task. Further example figures were taken from the literature.
Banitz, T., T. Hertz, L.-G. Johansson, E. Lindkvist, R. Martínez-Peña, S. Radosavljevic, M. Schlüter, K. Wennberg, P. K. Ylikoski, and V. Grimm. 2022. Visualization of causation in social-ecological systems. Ecology and Society 27(1):31.
https://doi.org/10.5751/ES-13030-270131
-
Everything flows in social ecological systems. Research needs to adapt
Focusing on processes and relations rather than entities can help solve key challenges in sustainability research
-
Groundbreaking book on methods to study social-ecological systems
Open-access book covers 28 broad groups of methods, featuring contributions from almost a hundred authors in 16 countries