NATURAL DISASTERS
How to reduce risks of flooding in and around urban areas
.jpg)
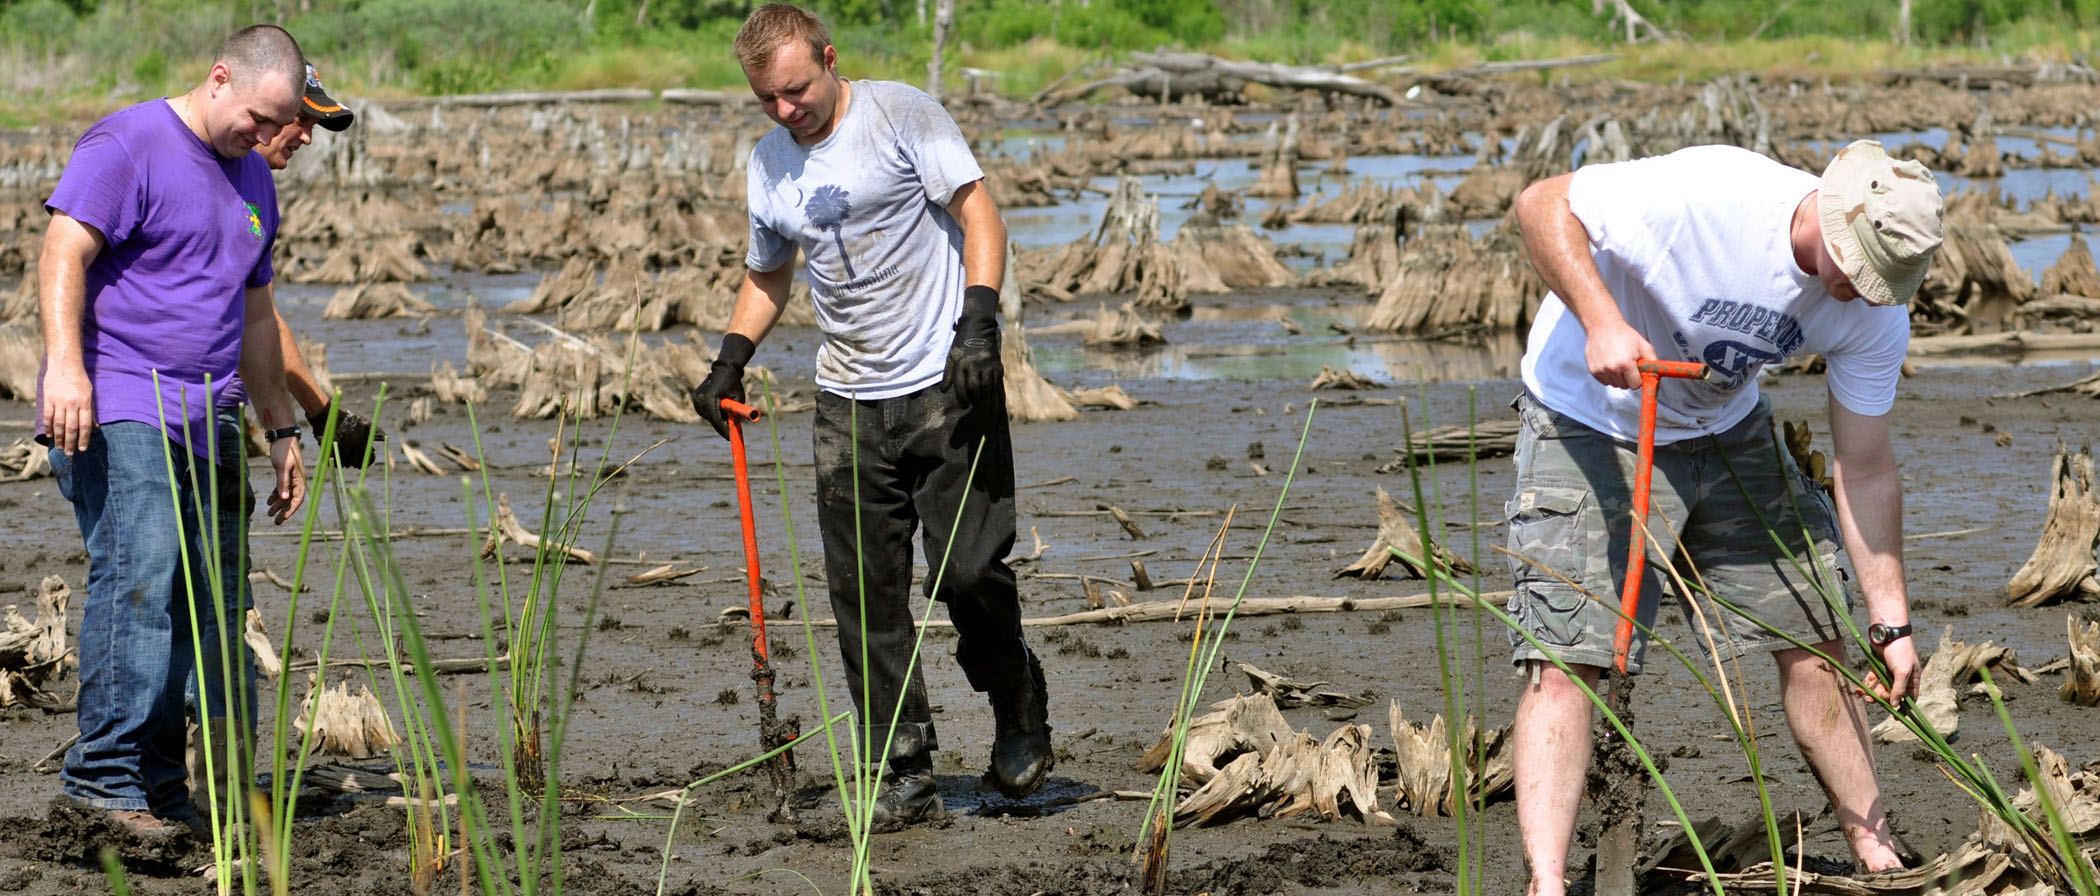
Researchers have developed a flood‐inundation mapping tool that identify not just areas prone to flooding, but adjacent zones that should be labelled ‘uncertain’. This helps extend the area that should be considered to be dangerous.Photo: T. Schmurr/Wikimedia Commons
New tool helps reveal dangerous areas that traditional assessments would otherwise ignore
- Many urban areas are still planned as if climate change does not occur
- Flooding is the natural hazard that historically has had the highest costs in terms of both economic impact and human deaths
- The new tool is based on a geographical information system (GIS) for delineating uncertainty zones, but does not require extensive knowledge in GIS and hydraulic modelling
TAKE THE UNCERTAIN FOR CERTAIN: Europe is witnessing the worst flooding since the second world war; torrential rain has forced the evacuation of more than 200,000 people in the Chinese province of Henan; similar downpours have causing the worst floods in decades in the Indian resort state of Goa.
And so on...
Many urban areas are still planned as if climate change does not occur. Flooding is the natural hazard that historically has had the highest costs in terms of both economic impact and human deaths, yet city planners often ignore the natural variation of earth surface processes and climate change, and see the riverine environment just as an attractive zone to build new houses.
As the summer of 2021 has shown, the consequences of such thinking can be disastrous.
Visualising uncertain areas
In a study published in Urban Planning, centre researcher Stephan Barthel with colleagues from University of Gävle and The Beijer Institute of Ecological Economics present a flood‐inundation mapping tool that identifies not just areas prone to flooding, but adjacent zones that should be labelled ‘uncertain’. This helps extend the area that should be considered to be dangerous.
The tool is based on a geographical information system (GIS) for delineating uncertainty zones, but does not require extensive knowledge in GIS and hydraulic modelling. It will produce uncertainty zones that are wide enough to capture most of the uncertainty area around the river. Thus, urban planners can use the tool’s result to design projects that are resilient and adaptive to the consequences of future flooding.
We believe there is a need to visualize zones of uncertainty in maps. These should be used both for policies and solutions that mitigate risk.
Sven Anders Brandt, lead author
Reducing risks by extending risk areas
If there is a risk involved, the researchers argue, and the size of the area at risk is uncertain, there should be a fair chance during the planning process that urban planners and decision makers consider not only the originally modelled extent of a flood event, but also include an extended area.
By doing so, there will be a number of positive side effects:
In addition to a decrease of the negative consequences of flooding, there will also be easier access to the river and strengthening of legal rights of public access for shoreline areas, which simultaneously may hold richer levels of biodiversity.
“Uncertainty, as a planning approach, would enable green city designs and opportunities for a number of ecosystem services, such as flood‐dependent agroforestry, and higher possibility of yielding cultural ecosystem services that promote people’s health,” the researchers conclude.
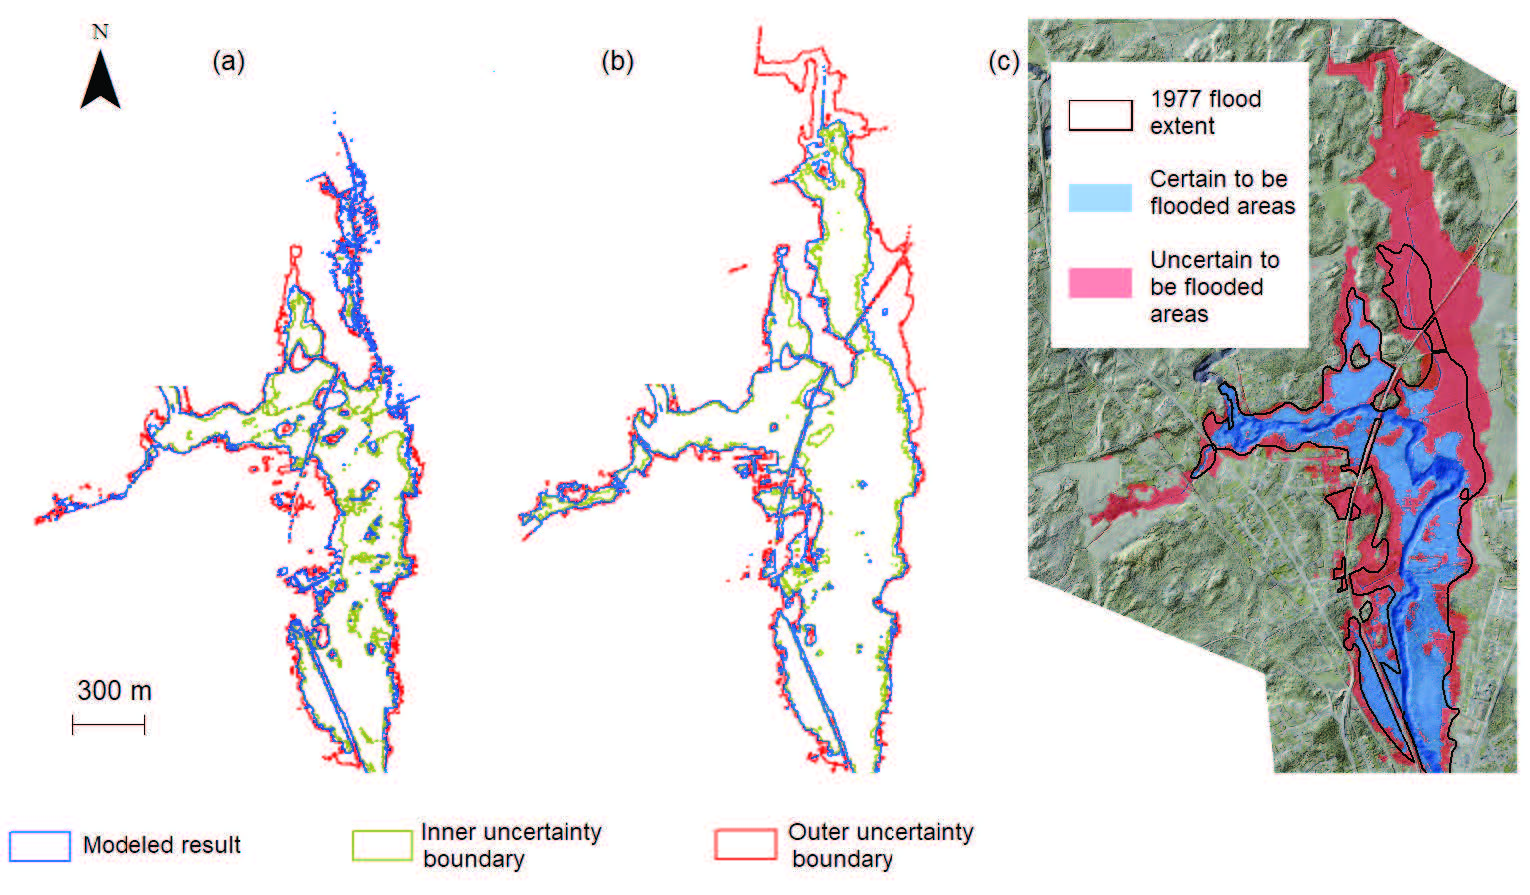
Example of model results produced by the new GIS‐tool. (a) Uncertainty zones fromlow‐roughness 1D model; (b) uncertainty zones from high‐roughness 1D model; and (c) resulting increased uncertaintyzone serving as a resilience zone.
How the tool was developed
The geographical information system (GIS) tool for delineating uncertainty zones around a modelled flood boundary was created with ArcGIS model builder and Python scripting language.
The tool consists of two parts: 1) preparation of the data to be used for the algorithm and 2) implementation of the uncertainty algorithm and mapping The x, y coordinates and the height (H) information derived from both datasets are used to compute the distance, slope (S, Eq. 2), coefficient c and exponent z (Eqs. 3 and 4, derived from the resolution [𝛿] and percentile [P]), and the disparity distance (Dd, Eq. 5) between the given node and WSE point. The status of each node is evaluated whether it is flooded, dry, or uncertain. Afterwards, all nodes are grouped per CS, part and side, and sorted according to distance. Tables are then created and named based on the groupings. Prior to the implementation of the algorithm, two empty tables that contain the computed outer and inner uncertain height values are created.
Brandt, S.A., Lim, N.J., Colding, J., Barthel. S. 2021. Mapping Flood Risk Uncertainty Zones in Support of Urban Resilience Planning. Urban Planning, Vol 6, No 3 (2021): Smart Urban Governance for Climate Change Adaptation. https://doi.org/10.17645/up.v6i3.4073