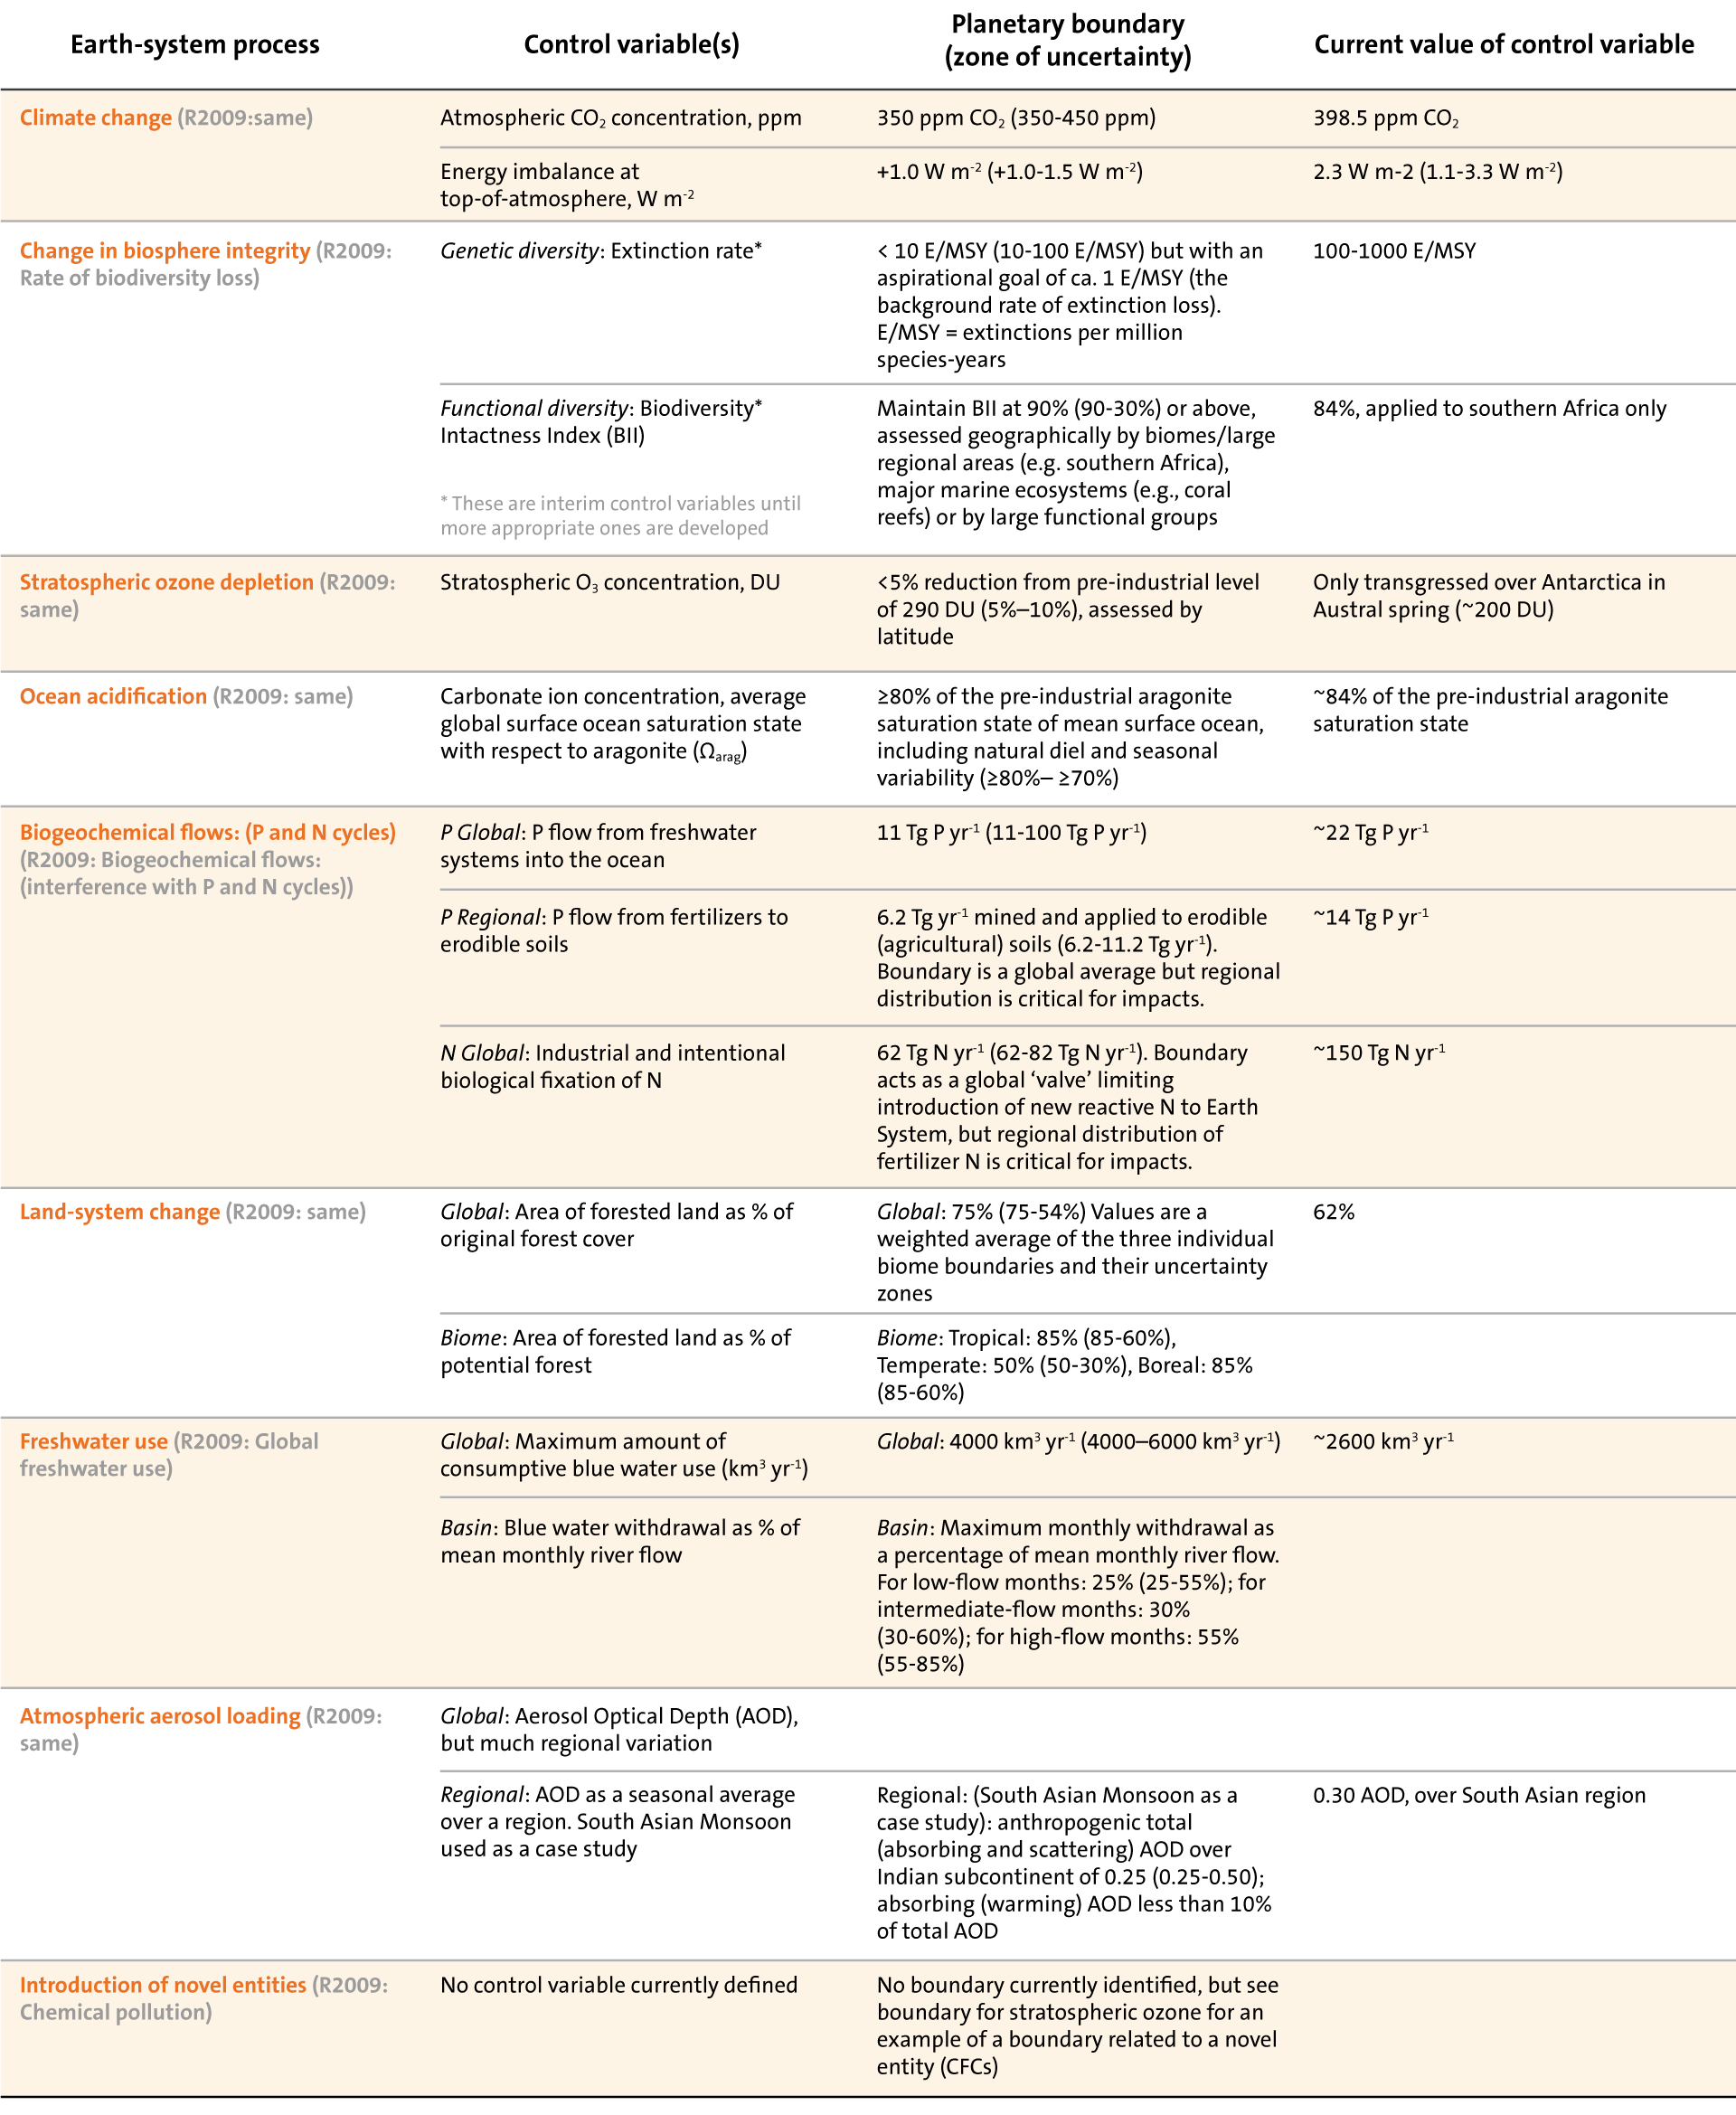
Table of the nine planetary boundaries

Bildtext får vara max två rader text. Hela texten ska högerjusteras om den bara ska innehålla fotobyline! Photo: B. Christensen/Azote
Earth System process | Control variable | Threshold avoided or influenced by slow variable | Planetary boundary (zone of uncertainty) | State of knowledge |
|---|---|---|---|---|
Climate change | Atmospheric CO2 concentration, ppm; Energy imbalance at Earth’s surface, W m-2. | Loss of polar ice sheets. Regional climate disruptions. Loss of glacial freshwater supplies. Weakening of carbon sinks. | Atmospheric CO2 concentration: 350 ppm (350-550 ppm) Energy imbalance:+1 W m-2 (+1.0 – +1.5 W m-2). | 1. Ample scientific evidence. 2. Multiple sub-system thresholds. 3. Debate on position of boundary. |
Ocean acidification | Carbonate ion concentration, average global surface ocean saturation state with respect to aragonite (Ωarag). | Conversion of coral reefs to algaldominated systems. Regional elimination of some aragonite- and high-magnesium calcite-forming marine biota Slow variable affecting marine carbon sink. | Sustain ≥ 80 % of the preindustrial aragonite saturation state of mean surface ocean, including natural diel and seasonal variability (≥80 % - ≥70 %). | 1. Geophysical processes well-known. 2. Threshold likely. 3. Boundary position uncertain due to unclear ecosystem response. |
Stratospheric ozone depletion | Stratospheric O3 concentration, DU. | Severe and irreversible UV-B radiation effects on human health and ecosystems. | <5% reduction from preindustrial level of 290 DU (5 - 10 %). | 1. Ample scientific evidence. 2. T hreshold well established. 3. Boundary position implicitly agreed and respected. |
Atmospheric aerosol loading | Overall particulate concentration in the atmosphere, on a regional basis. | Disruption of monsoon systems. Human health effects. Interacts with climate change and freshwater boundaries. | To be determined | 1. Ample scientific evidence. 2. Global threshold behaviour unknown. 3. Unable to suggest boundary yet. |
Nitrogen and phosphorus inputs to the biosphere and oceans | P: inflow of phosphorus to ocean, increase compared to natural background weathering N: amount of N2 removed from atmosphere for human use, Mt N yr-1 | P: avoid a major oceanic anoxic event (including regional), with impacts on marine ecosystems. N: slow variable affecting overall resilience of ecosystems via acidification of terrestrial ecosystems and eutrophication of coastal and freshwater systems. | P: < 10× (10× - 100×) N: Limit industrial and agricultural fixation of N2 to 35 Mt N yr-1, which is ~ 25% of the total amount of N2 fixed per annum naturally by terrestrial ecosystems (25- 35%) | P: (1) Limited knowledge on ecosystem responses; (2) High probability of threshold but timing is very uncertain; (3) Boundary position highly uncertain. N: (1) Some ecosystem responses known; (2) Acts as a slow variable, existence of global thresholds unknown; (3) Boundary position highly uncertain. |
Global freshwater use | Consumptive blue water use, km3 yr-1. | Could affect regional climate patterns (e.g., monsoon behaviour). Primarily slow variable affecting moisture feedback, biomass production, carbon uptake by terrestrial systems and reducing biodiversity | < 4,000 km3 yr-1 (4,000 - 6,000 km3 yr-1) | 1. Scientific evidence of ecosystem response but incomplete and fragmented. 2. Slow variable, regional or subsystem thresholds exist. 3.. Proposed boundary value is a global aggregate, spatial distribution determines regional thresholds. |
Land system change | Percentage of global land cover converted to cropland. | Trigger of irreversible & widespread conversion of biomes to undesired states. Primarily acts as a slow variable affecting carbon storage and resilience via changes in biodiversity and landscape heterogeneity. | ≤ 15% of global ice-free land surface converted to cropland (15 – 20%). | 1. Ample scientific evidence of impacts of land cover change on ecosystems, largely local and regional. 2. Slow variable, global threshold unlikely but regional thresholds likely. 3. Boundary is a global aggregate with high uncertainty, regional distribution of land system change is critical. |
Biodiversity loss | Extinction rate , extinctions per million species per year (E/MSY). | Slow variable affecting ecosystem functioning at continental and ocean basin scales. Impact on many other boundaries – C storage, freshwater, N and P cycles, land systems. Massive loss of biodiversity unacceptable for ethical reasons. | < 10 E/MSY (10 – 100 E/MSY) | 1. Incomplete knowledge on the role of biodiversity for ecosystem functioning across scales. 2. Thresholds likely at local and regional scales 3. Boundary position highly uncertain. |
Chemical pollution | For example, emissions, concentrations, or effects on ecosystem and Earth system functioning of persistent organic pollutants (POPs), plastics, endocrine disruptors, heavy metals, and nuclear wastet. | Thresholds leading to unacceptable impacts on human health and ecosystem functioning possible but largely unknown. May act as a slow variable undermining resilience and increase risk of crossing other threshold. | To be determined | 1. Ample scientific evidence on individual chemicals but lacks an aggregate, global-level analysis. 2. Slow variable, large-scale thresholds unknown. 3. Unable to suggest boundary yet. |