Figures and data for the updated Planetary Boundaries
Below are the figures, illustrations and data sources from the 2015 update of the Planetary Boundaries, (Steffen et. al, 16 January 2015, Science)
Main figures
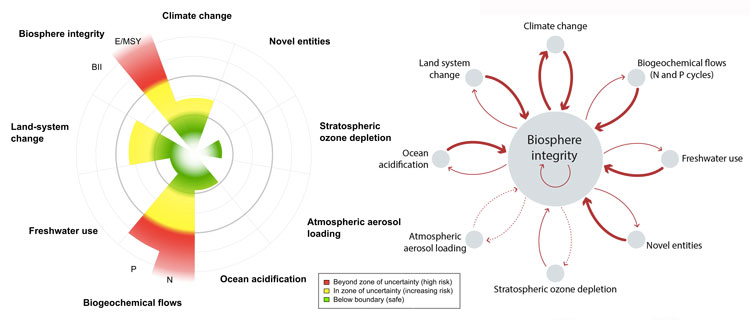
Fig. 1. The conceptual framework for the planetary boundaries approach

Source: Steffen and others, 16 January 2015, Science
Fig, 2. The global distributions and current status of the control variables for (A) biogeochemical flows – P, (B) biogeochemical flows – N, (C) land-system change, and (D) freshwater use
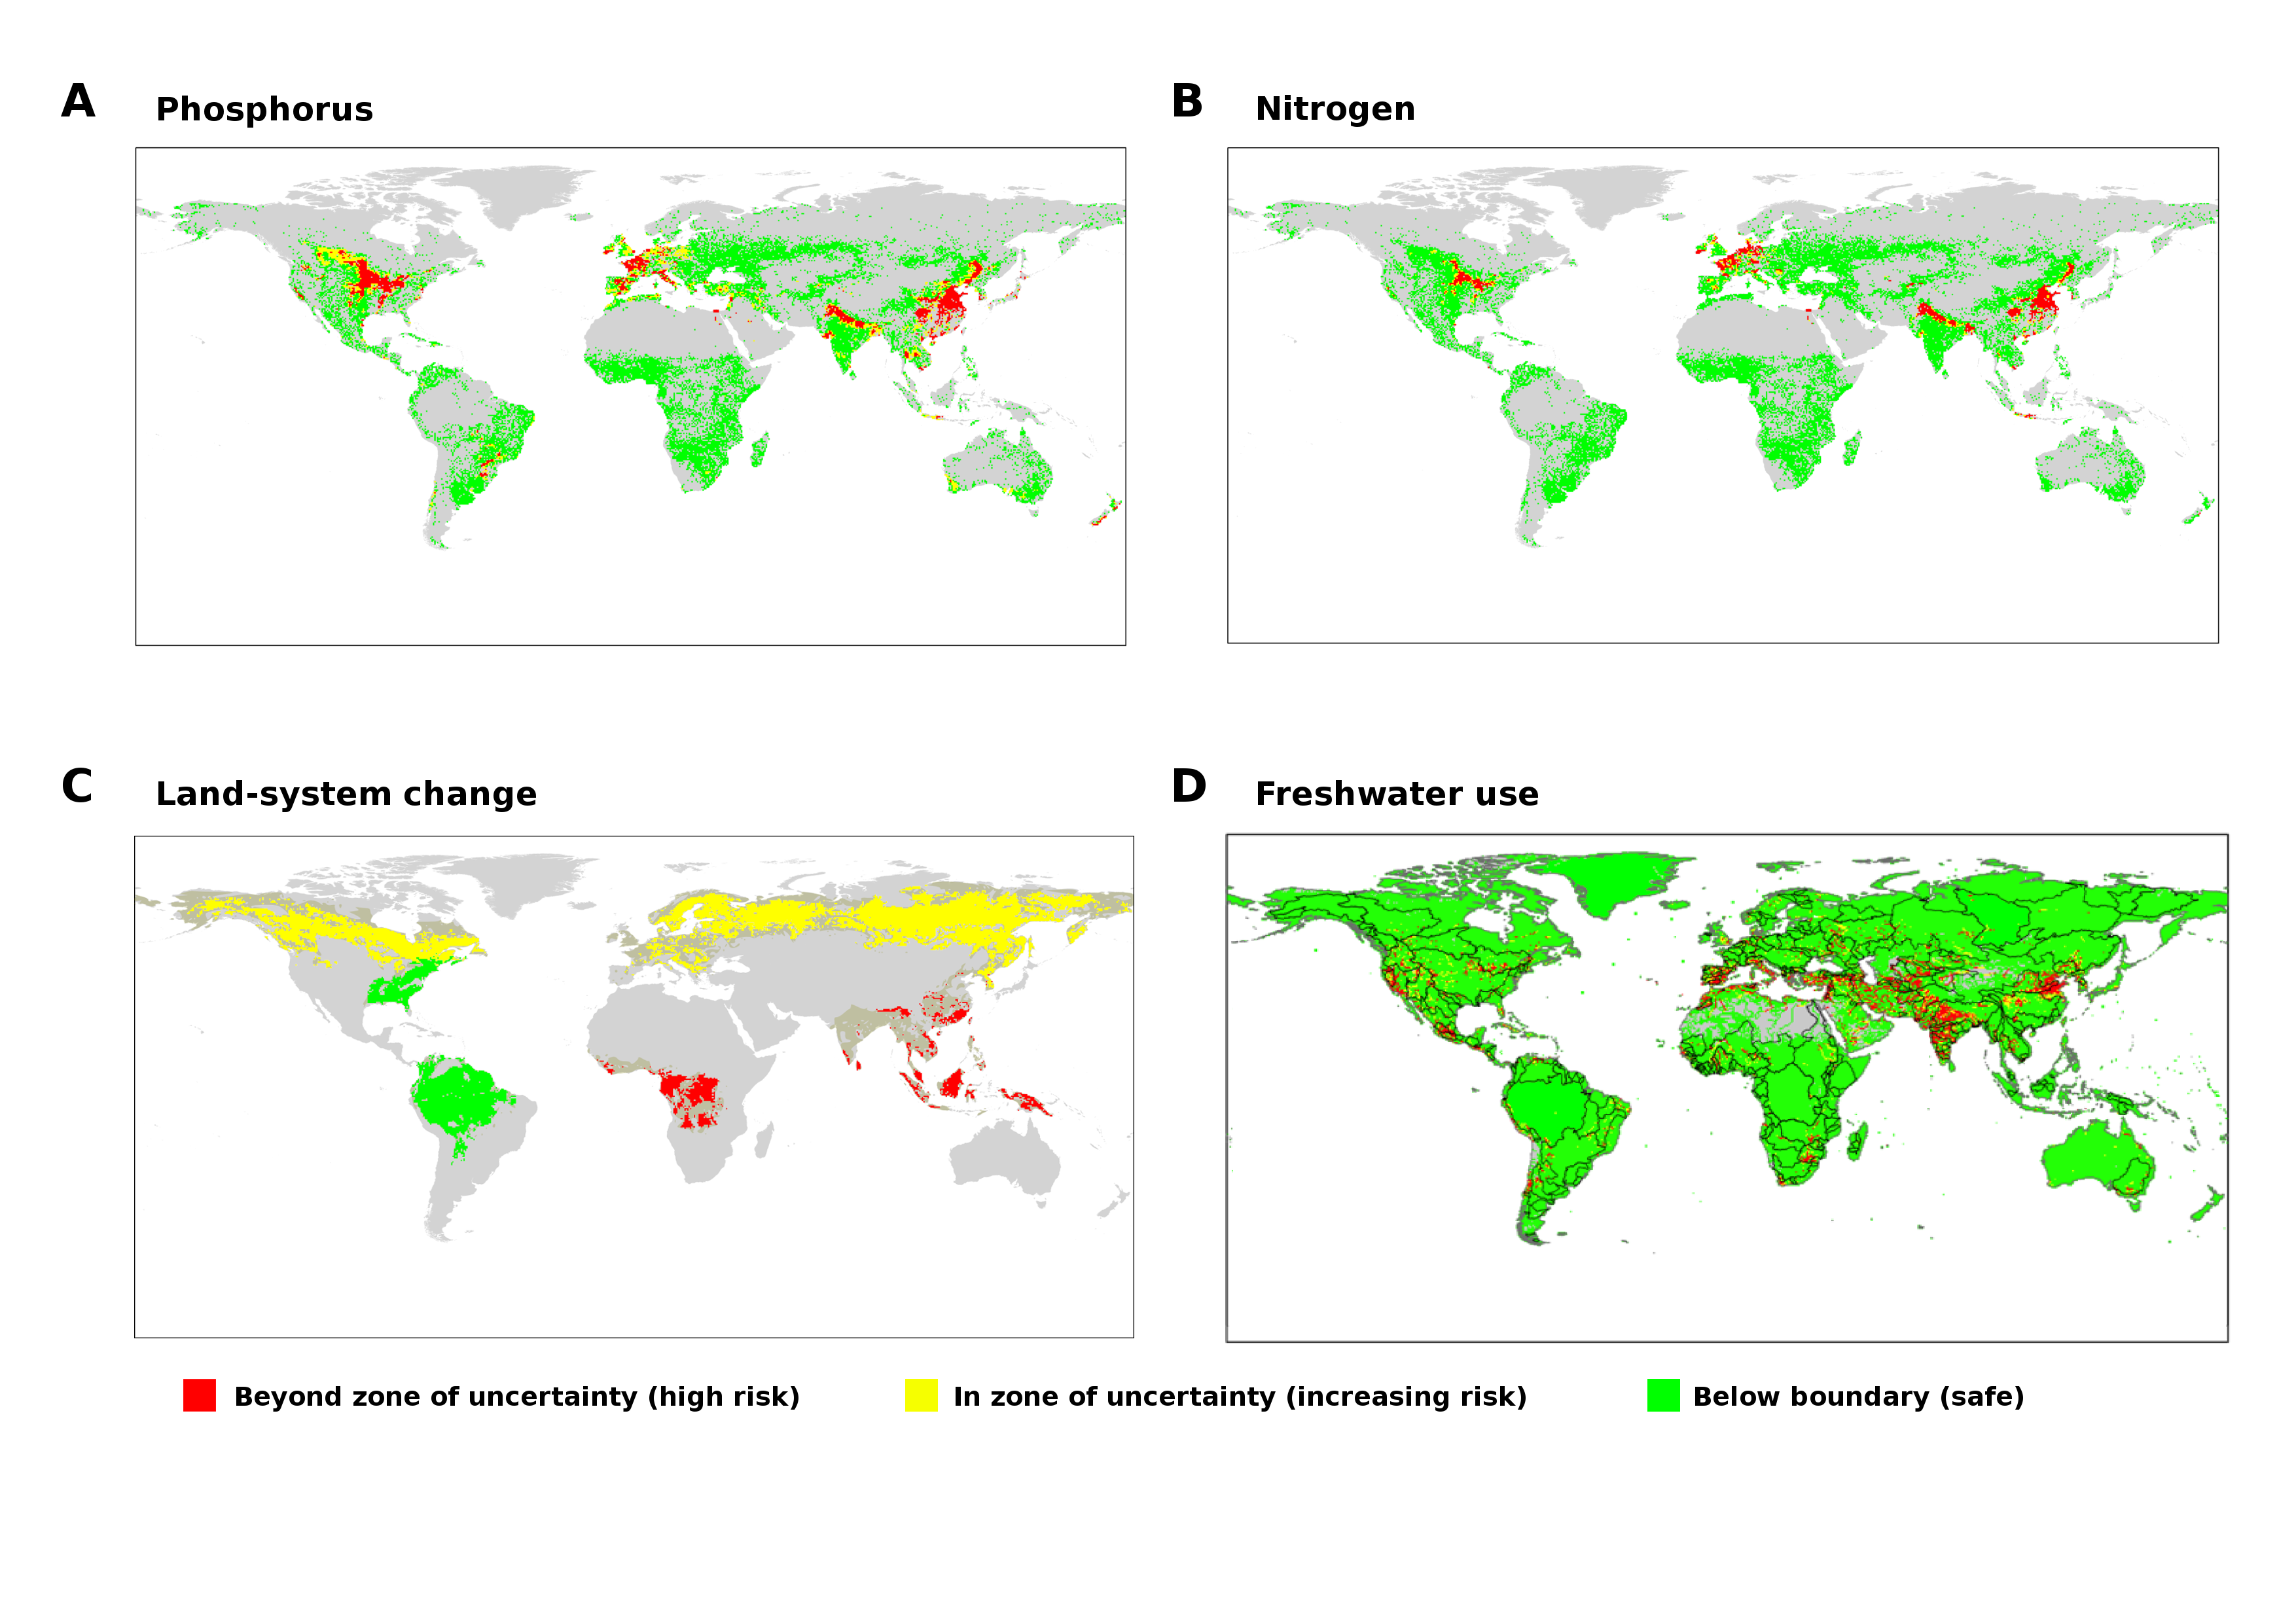
Source: Steffen and others, 16 January 2015, Science
Fig. 3. The current status of the control variables for seven of the nine planetary boundaries
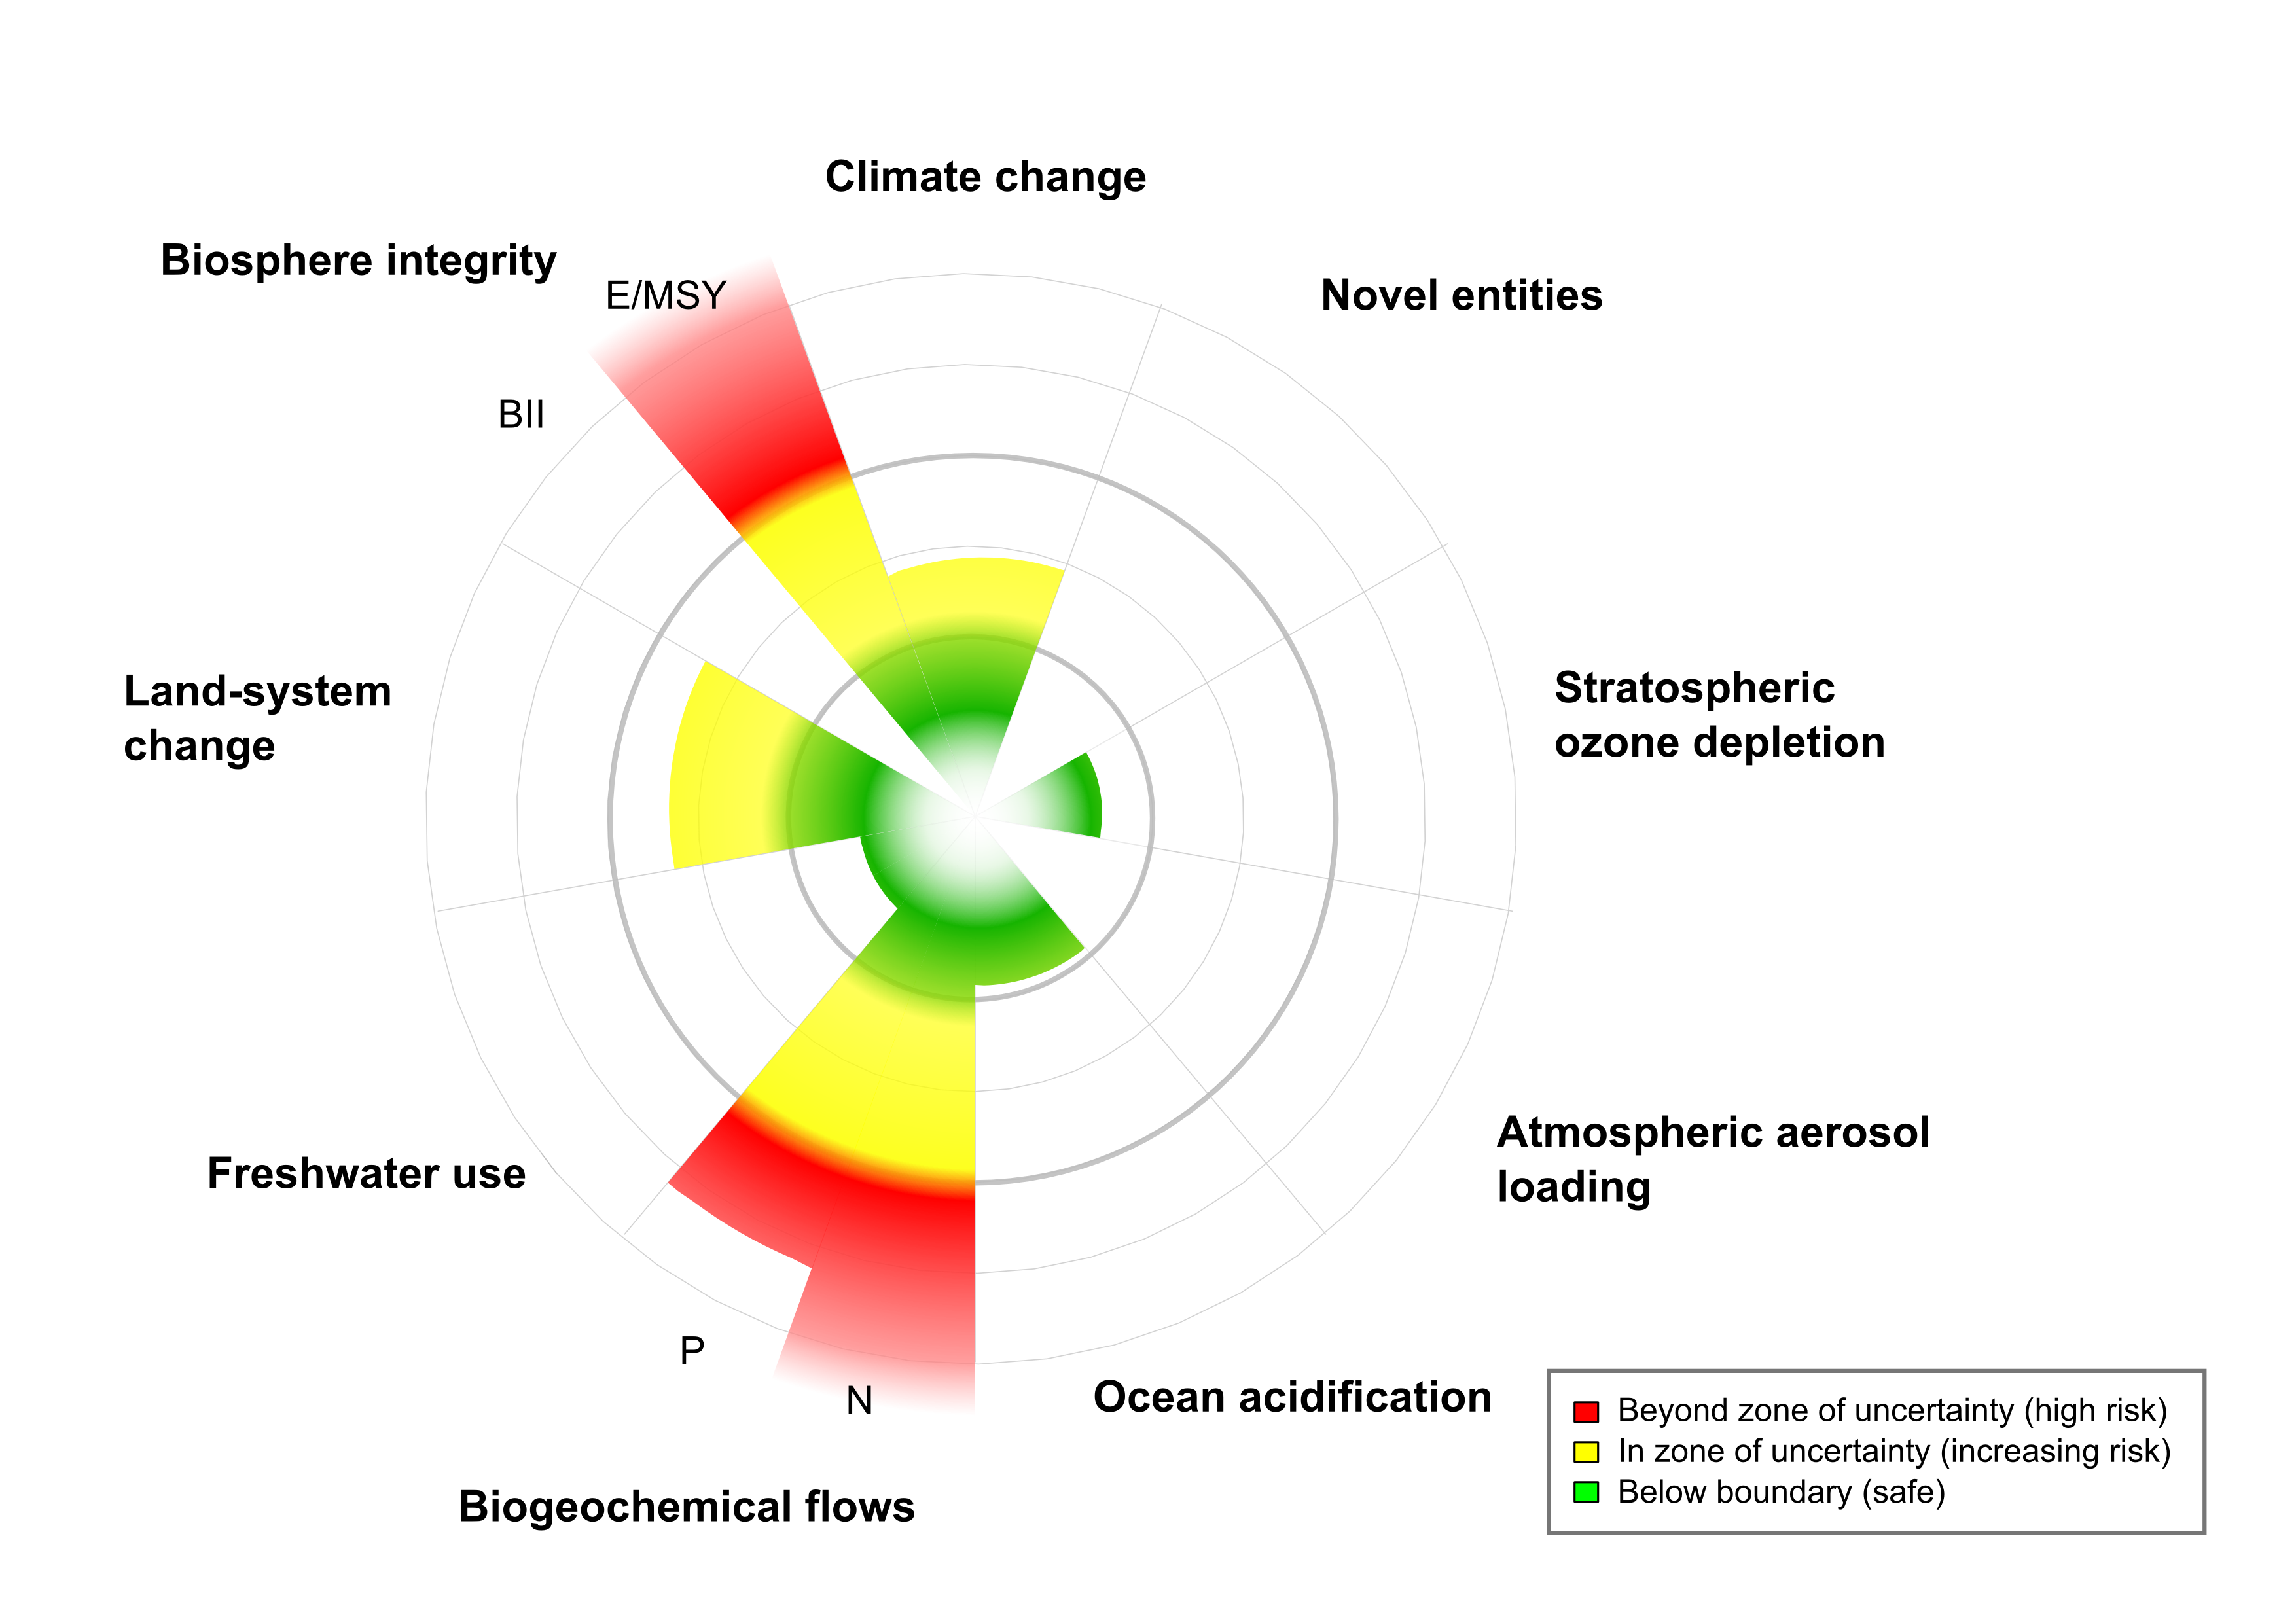
Download source data Text file, 375 bytes.
Source: Steffen and others, 16 January 2015, Science
If you wish to use this figure you need to obtain copyright permission from Science.
Click here to go to the instructions for requesting permission.
Supplementary figures
Fig. S1. The 420,000-year Vostok (Antarctica) ice core record, showing the regular pattern of atmospheric CO2 and CH4 concentration and inferred temperature through four glacial-interglacial cycles

Adapted from: J.R. Petit et al., Climate and atmospheric history of the past 420,000 years from the Vostok ice core, Antarctica. Nature 399, 429-436 (1999). doi:10.1038/20859
Fig. S2. Record of δ18O per mil (scale on left) from the Greenland Ice Sheet Project (GRIP) ice core, a proxy for atmospheric temperature over Greenland (approximate temperature range on oC relative to Holocene average is given on the right, showing the relatively stable Holocene climate during the past ca. 10,000 years and DansgaardOeschger events (numbered) during the preceding colder glacial climate
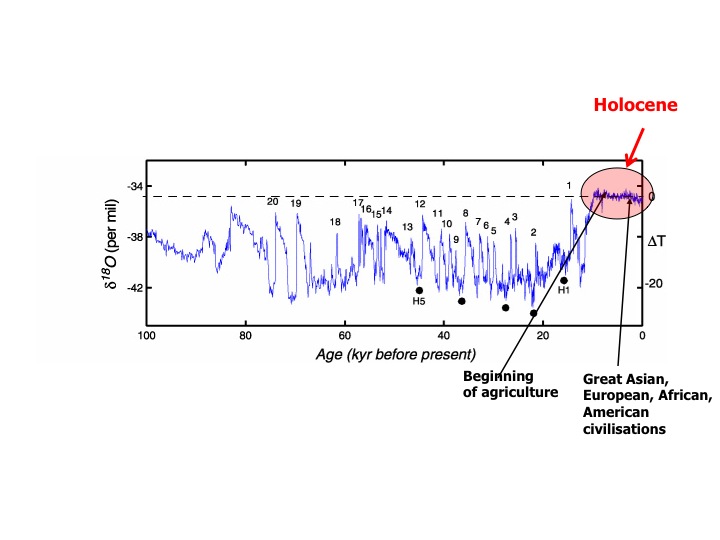
Adapted from: Young and Steffen, 2009, Principles of Ecosystem Stewardship, Springer-Verlag
Fig. S3. The global distribution of combined relative mean species abundance of original species (MSA) as an approximation of the aggregated human pressure on the terrestrial biosphere
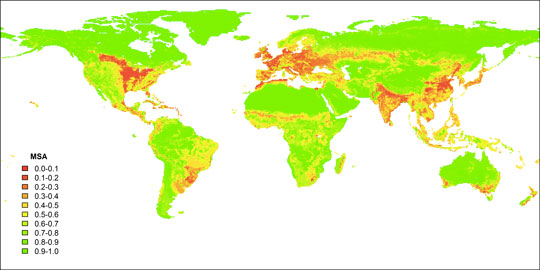
Reference: R. Alkemade et al., GLOBIO3: A framework to investigate options for reducing global terrestrial biodiversity loss. Ecosys. 12, 374-390 (2009). doi: 10.1007/s10021-009-9229-5
Data source: Data available from author
Fig. S4. The ocean acidification boundary: values of the control variable, aragonite saturation state (Ωarag), under (a) 280 (pre-industrial state); (b) 380; (c) 400 (approximately current state); (d) 450; (e) 500; and (f) 550 ppm atmospheric CO2 concentrations.

Reference: O. Hoegh-Guldberg et al., Coral reefs under rapid climate change and ocean acidification. Science 318, 1737-1742 (2007). doi: 10.1126/science.1152509
Data source: Data available from author
Fig. S5A. Geographical distribution of the control variable for phosphorus for the biogeochemical flows boundary, highlighting large agricultural zones where the P boundary is transgressed.
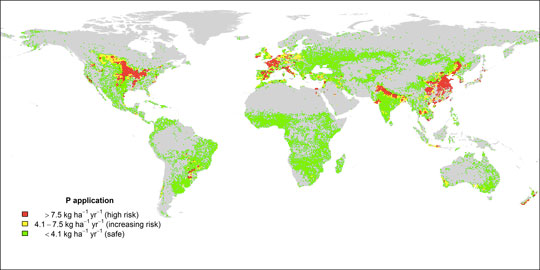
Reference: P. Potter, N. Ramankutty, E.M. Bennett, S.D. Donner, Characterizing the spatial patterns of global fertilizer application and manure production. Earth Interact. 14, 1-22 (2010). doi: 10.1175/2009EI288
Data source: http://www.earthstat.org/
Fig. S5B. Geographical distribution of the control variable for nitrogen for the biogeochemical flows boundary, highlighting large agricultural zones where the N boundary is transgressed.
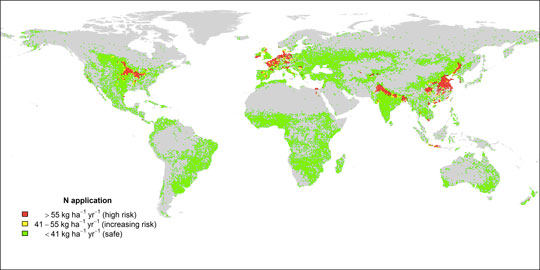
Reference: P. Potter, N. Ramankutty, E.M. Bennett, S.D. Donner, Characterizing the spatial patterns of global fertilizer application and manure production. Earth Interact. 14, 1-22 (2010). doi: 10.1175/2009EI288
Data source: http://www.earthstat.org/
Fig. S6. Area of forest cover remaining in the world’s major forest biomes compared to the potential forest cover, color-coded to show the position of the control variable (area of forest land remaining) with respect to the boundary.
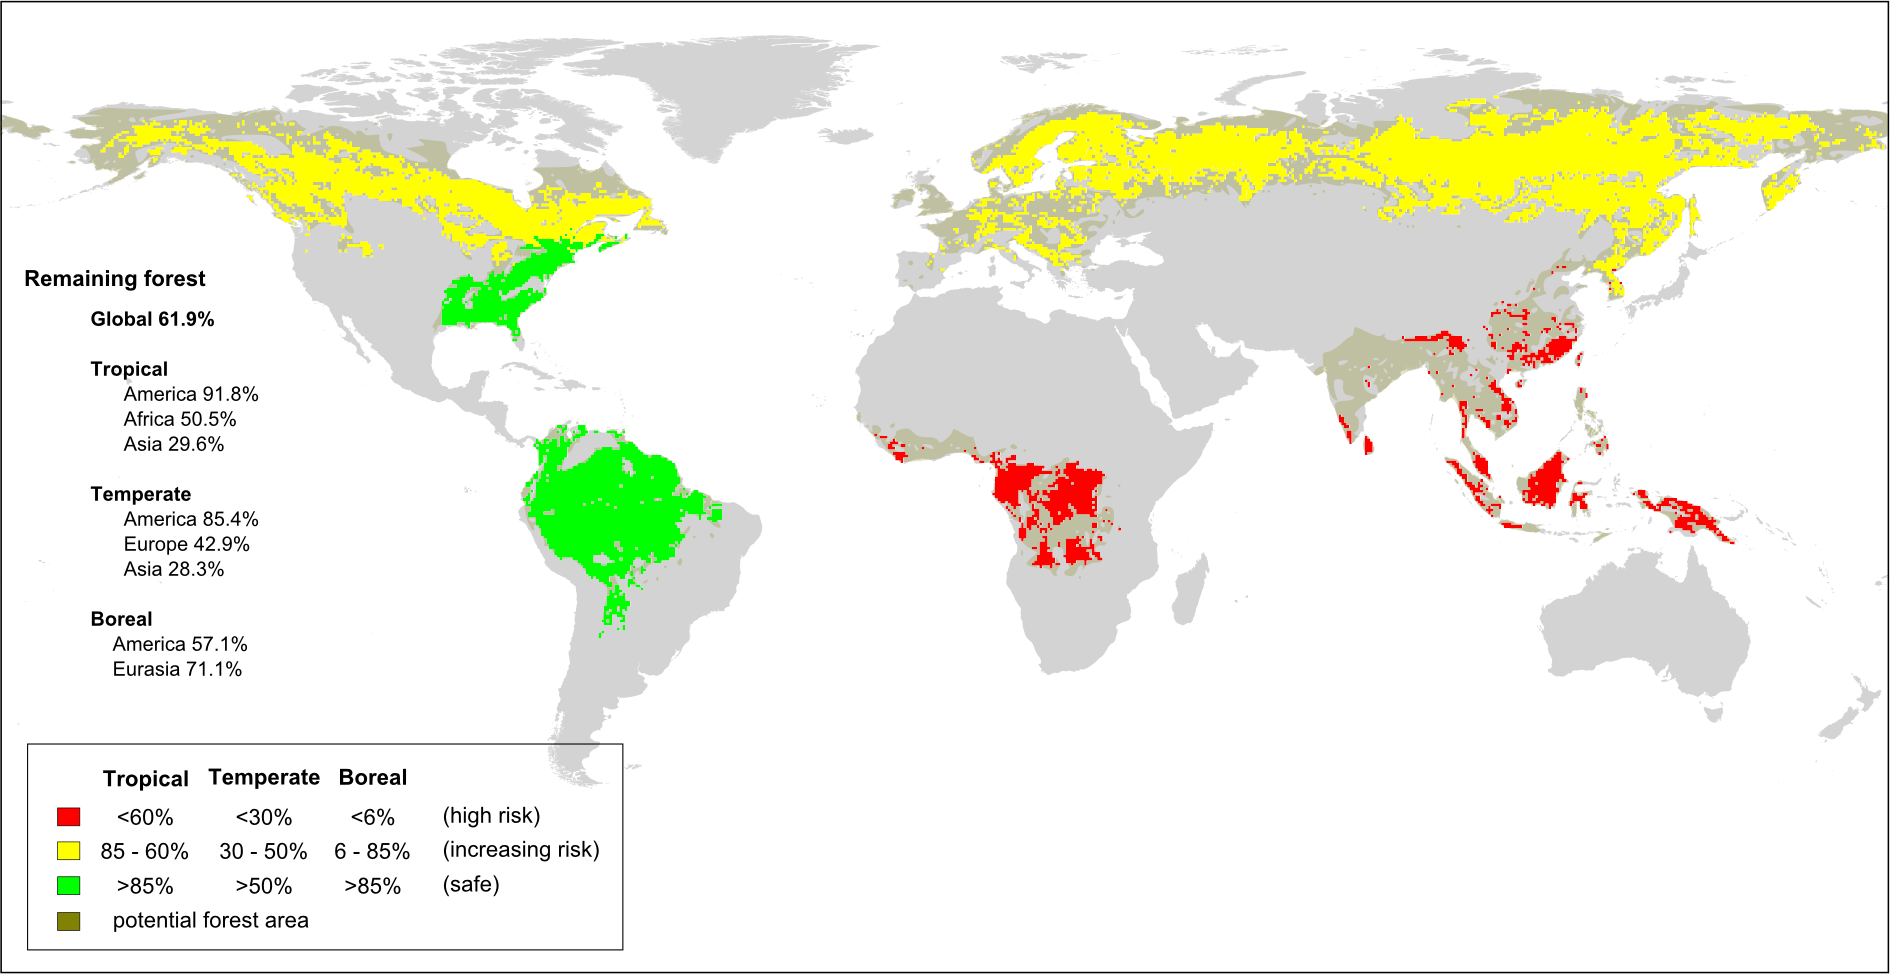
Reference (crop land cover): N. Ramankutty, J.A. Foley, Estimating historical changes in global land cover: Croplands from 1700 to 1992. Global Biogeochem. Cycles 13, 997-1027 (1999). doi: 10.1029/1999GB900046
Data source: http://webmap.ornl.gov/wcsdown/dataset.jsp?ds_id=961
Reference (vegetation cover): O. Arino et al., Global Land Cover Map for 2009 (GlobCover 2009). © (European Space Agency (ESA) & UniversitÈ catholique de Louvain (UCL), 2012). doi:10.1594/PANGAEA.787668
Data source: http://due.esrin.esa.int/globcover/
Fig. S7. Transgression of the allowed monthly water withdrawals defined by EWF, plotted as the degree of exceedance (fraction of maximum allowed level) during months that show such an exceedance.
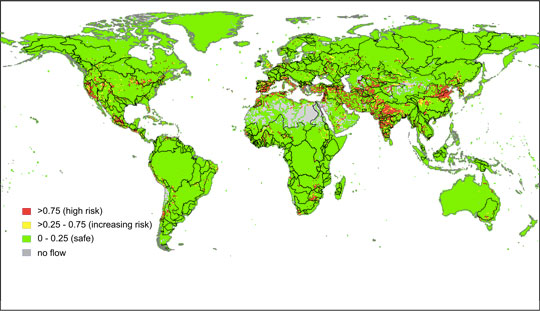
Reference: A.V. Pastor et al., Hydrol. Earth Sys. Sci. 18, 5041-5059 (2014)
Modeling and Calculations done by J.Heinke and D.Gerten with LPJmL at PIK, Potsdam, Germany
Data source: Request data
Fig. S8. Upper panel: Number of months per year with a transgression (by any degree) of allowed water withdrawals, corresponding to Figure S7. Lower panel: Risk index, defined as the product of duration and severity of transgression.
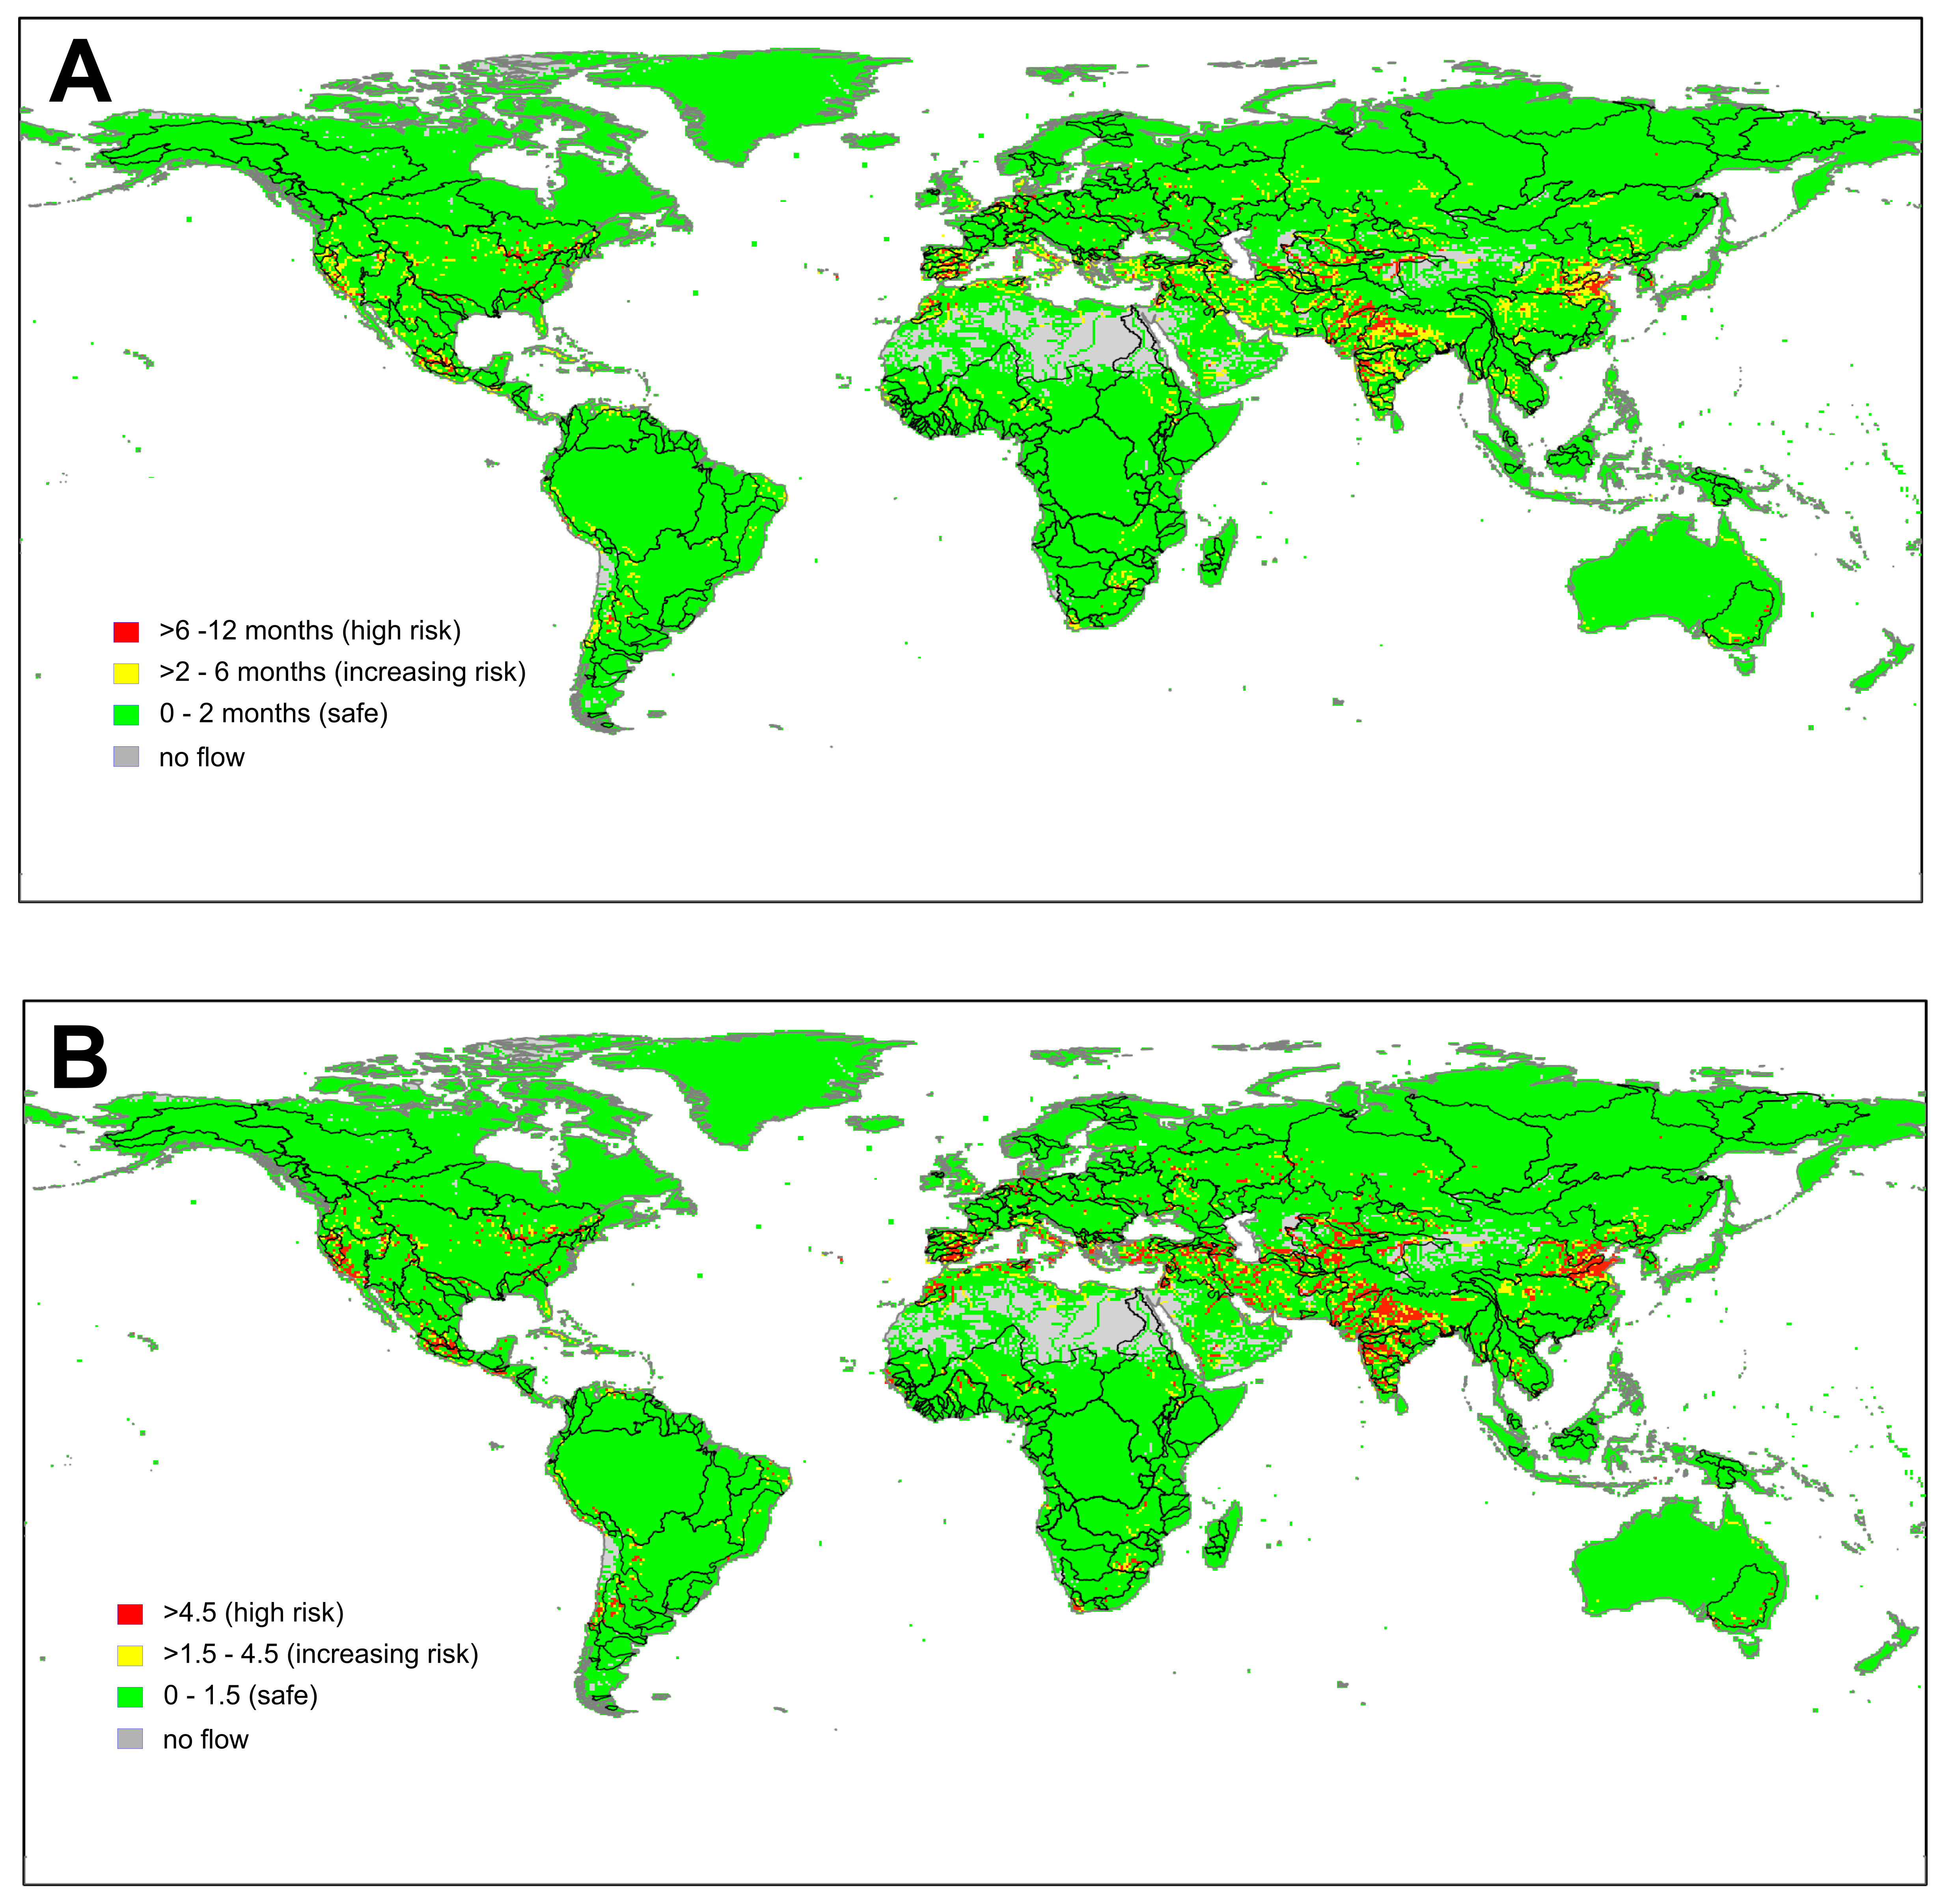
Reference: A.V. Pastor et al., Hydrol. Earth Sys. Sci. 18, 5041-5059 (2014)
Modeling and Calculations done by J.Heinke and D.Gerten with LPJmL at PIK, Potsdam, Germany
Data source: Request data
Fig. S9. Heating of the air by black and brown carbon (top panel) and dimming of the surface by all aerosols, including co-emitted aerosols (bottom panel).
Reference: V. Ramanathan, G. Carmichael, Global and regional climate changes due to black carbon. Nature Geosci. 1, 221-227 (2008). doi:10.1038/ngeo156
Fig. S10. The interaction between the biosphere integrity planetary boundary and other planetary boundaries.

Adapted from: G.M. Mace et al., Approaches to defining a planetary boundary for biodiversity. Global Environ. Change 28, 289-297 (2014). doi: 10.1016/j.gloenvcha.2014.07.009
Other data sources
F.S. Rowland, Stratospheric ozone depletion, Phil. Trans. Roy. Soc. Lond. Ser. B 361, 769-790 (2006). doi: 10.1098/rstb.2005.1783
IPCC AR5 WG1 Summary for policy makers
http://www.ipcc.ch/pdf/assessment-report/ar5/wg1/WGIAR5_SPM_brochure_en.pdf, IPCC, 2013: Summary for Policymakers. In: Climate Change 2013: The Physical Science Basis. Contribution of Working Group I to the Fifth Assessment Report of the Intergovernmental Panel on Climate Change [Stocker, T.F., D. Qin, G.-K. Plattner, M. Tignor, S. K. Allen, J. Boschung, A. Nauels, Y. Xia, V. Bex and P.M. Midgley (eds.)]. Cambridge University Press, Cambridge, United Kingdom and New York, NY, USA
V. Ramanathan, G. Carmichael, Global and regional climate changes due to black carbon. Nature Geosci. 1, 221-227 (2008). doi:10.1038/ngeo156
For more information about the data please contact Ingo Fetzer